We had an interesting comment from a reader this week regarding the visualization posted plotting actual points with expected points. My proposition was that the players whose xP trailed their actual points by a distance were likely undervalued by the market, and while we wouldn't suggest they will somehow "make up" those points left on the table to date, we would expect their production to take an uptick assuming they continue to get chances and playing time at a relatively consistent rate. The reader had a different view:
"When I look at this chart I don't see underperformers or overperformers all I see is players on form who are capitalising on their chances (Ramsey and Rooney) and players who are of such quality that they will always out perform the normal (Aguero and Yaya) . . . I believe that if you reconstructed this table after xmas with a start date of tomorrow then the same players would occupy the two sides."
It's a fair proposition and one I wanted to examine further. I think there's a general discomfort with the idea of regressing players' production to the mean as it seems to suggest they are all created equally. A couple of responses to that:
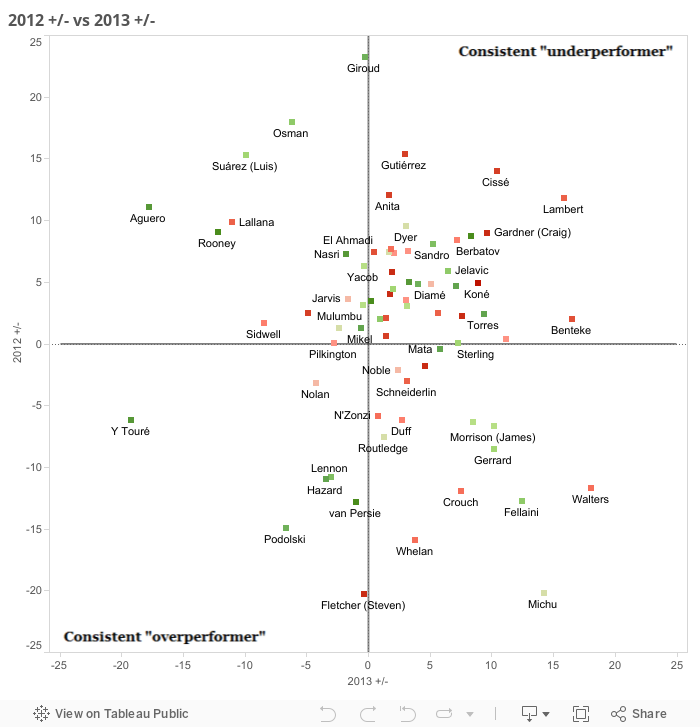 The first observation is that we see very little correlation from year to year. 10 players outperformed their points total last season by at least 10 points, yet only one of these (Podolski) has managed to outperform his total to date by even 5 points. Similarly, eight players underperformed their underlying stats by 10 or more points last season, and of these two (Lambert and Cisse) have once again failed to match their live up to expectations. On the flip side we've seen players like Aguero, Rooney, Lallana, Suarez, Michu, Walters and Fellaini benefit or suffer from huge reversals in fortune over the two samples.
One of the things I love about sports writing is that it can be a gateway into so many interesting subjects, and while I'm not learned enough to talk about most of them here, I would venture that there is an element of bias regarding the way we judge the above. When a player like Ramsey explodes in a small sample, we tend to quickly absorb that information into our collective psyche and it becomes the new self evident truth that he is a great player (despite several seasons of reasonable yet unspectacular play, at least from a fantasy perspective). We then place too much weight on these recent events, much like how people stop swimming after a shark attack, despite the fact there are countless things more likely to really kill them that they ignore every day. I believe the term for this specific type of bias is referred to as the availability heuristic.
In the chart we see Aguero has the second highest +/- score for 2013 and one could rationalise that being due to his superior skill and quality teammates. Indeed, that's possibly true to a point. However, he had those very same skills and most of the teammates last year too, yet was actually one of the biggest underperformers last year, serving as a constant source of frustration for his owners. Or take van Persie. Last year he ascended to a new level and was casually thrown into conversations alongside the best in the world, and thus the fact he outperformed his xP by a full 13 points through half a year could be discounted as him simply being better than everyone else. Fast forward 10 months and we have a player who has only just caught up to his xP total for the year, having suffered through some bad luck these past couple of months.
As a final check, the colour coding relates to the players' team's league position ranging from 1st (green) to last (red). I wondered if we'd tend to see players from the better teams show an ability to repeat positive seasons as they benefit from more quality chances per game. I guess this works to a degree in that those in the bottom left quadrant generally play for better teams, yet there's not enough here to really draw any solid conclusions.
It's always good to challenge forecasts like the ones you find in these pages - especially the ones found in these pages! - but caution should also be exercised when dismissing data which contradicts our current view of the game. There are certainly aspects of a player's game which can consistently be above average (SoT% for one) but others seem far less repeatable. The current iteration of the model adjusts for these differences and thus that's why we're going to see turnover in the players who over or underachieve expectations.
"When I look at this chart I don't see underperformers or overperformers all I see is players on form who are capitalising on their chances (Ramsey and Rooney) and players who are of such quality that they will always out perform the normal (Aguero and Yaya) . . . I believe that if you reconstructed this table after xmas with a start date of tomorrow then the same players would occupy the two sides."
It's a fair proposition and one I wanted to examine further. I think there's a general discomfort with the idea of regressing players' production to the mean as it seems to suggest they are all created equally. A couple of responses to that:
- For conversion rates which appear to be repeatable year on year, such as shot on target percentage (SoT%), we regress players to their own historical rates (where available). This means that if we say Olivier Giroud has an unsustainable SoT%, we're not saying his is too high compared with Danny Graham or Frazier Campbell, we're saying it's way above his own historic rate.
- For conversion rates where we do regress to a league average (or at least use league average in a weighted average), it's because I haven't seen any evidence that players can consistently perform above the average in that given rate. The classic example is goals per shot on target (G/SoT) which tends to regress close to a mean for most players, with only a couple exceeding the average for more than a couple of years in a row (and that would be expected even if we were talking about a totally random event). There might be some repeatability there, but it's a lot less than most would expect based on purely on notions like "form", "class" or being "clinical".
The good news is that this is fairly easy to test. Below we've plotted players' +/- score as of this week (which shows the difference between their actual and expected points with a positive score meaning their expected exceeds their actual) against the same metric from the midway point of last season. I picked that point in time based on the reader comment about Christmas but I'm fairly confident a similar conclusion could be drawn from pretty much any two comparable samples:
One of the things I love about sports writing is that it can be a gateway into so many interesting subjects, and while I'm not learned enough to talk about most of them here, I would venture that there is an element of bias regarding the way we judge the above. When a player like Ramsey explodes in a small sample, we tend to quickly absorb that information into our collective psyche and it becomes the new self evident truth that he is a great player (despite several seasons of reasonable yet unspectacular play, at least from a fantasy perspective). We then place too much weight on these recent events, much like how people stop swimming after a shark attack, despite the fact there are countless things more likely to really kill them that they ignore every day. I believe the term for this specific type of bias is referred to as the availability heuristic.
In the chart we see Aguero has the second highest +/- score for 2013 and one could rationalise that being due to his superior skill and quality teammates. Indeed, that's possibly true to a point. However, he had those very same skills and most of the teammates last year too, yet was actually one of the biggest underperformers last year, serving as a constant source of frustration for his owners. Or take van Persie. Last year he ascended to a new level and was casually thrown into conversations alongside the best in the world, and thus the fact he outperformed his xP by a full 13 points through half a year could be discounted as him simply being better than everyone else. Fast forward 10 months and we have a player who has only just caught up to his xP total for the year, having suffered through some bad luck these past couple of months.
As a final check, the colour coding relates to the players' team's league position ranging from 1st (green) to last (red). I wondered if we'd tend to see players from the better teams show an ability to repeat positive seasons as they benefit from more quality chances per game. I guess this works to a degree in that those in the bottom left quadrant generally play for better teams, yet there's not enough here to really draw any solid conclusions.
It's always good to challenge forecasts like the ones you find in these pages - especially the ones found in these pages! - but caution should also be exercised when dismissing data which contradicts our current view of the game. There are certainly aspects of a player's game which can consistently be above average (SoT% for one) but others seem far less repeatable. The current iteration of the model adjusts for these differences and thus that's why we're going to see turnover in the players who over or underachieve expectations.
No comments:
Post a Comment