The revised strategy for this season is to post the weekly preview data as soon as possible, giving you (a) the chance to use it to help with any early transfer decisions and (b) to collate questions on why a given player is so low or high, to be answered on Fridays before the transfer deadline.
Monday, October 28, 2013
Thursday, October 24, 2013
Gameweek 9 Preview
Given how early in the season we are, the model is still liable to throw up the odd outlier and so in these weekly posts I plan to address those, shall we say, unexpected results. In future weeks, the plan is to post the data as soon as possible after the final games' data is up and then you can raise questions/issues during the week, to be addressed on either the following Thursday or Friday. For this week, I'll just try and guess where the questions might lie:
Keiren Westwood
Sunderland have conceded at least two goals in six straight contests, yet the model thinks they'll do okay this week. What gives? Well, having conceded 7.3 shots inside the box at home, they're hardly a team without hope (that alone would be the 9th best total of the teams playing this week). Add to that the fact that Newcastle have averaged 30% less SiB against their opponents than average, while only averaging 6.0 SiB on their travels, and you get a game where we're expecting Sunderland to only concede a handful of good chances (5.3 SiB) which gives them their best shot at a clean sheet to date (36% based on historic averages for team surrendering those shot totals).
Seamus Coleman over Leighton Baines
In reality this ranking is too close to pick between and essentially the model is saying they are equal. Baines is actually worth a little more because we know he has a steadier source of shots from set pieces, but those from free kicks are of course built into the model already, yet Coleman still comes out on top. Coleman has accounted for 6% of Everton's SiB compared to just 2% for Baines, hitting the target more frequently (50% vs 25%) too. Baines has a very slight edge (15% vs 13%) in the created chance department but to date these players have been very close and the 2.1m premium looks tough to justify.
Mezut Ozil
As much as Ozil has impressed to date, his current forecast of close to eight points looks aggressive compared to his peers who top out at just six. The only real explanation for this is small sample size and some of his somewhat fortunate conversion rates which aren't fully regressed in the weekly forecasts. The main culprit is that 88% SoT% which inflates his shot expectation for the week, even when adjusted for his historic average. Saying that, the data suggests Arsenal to top 13 SiB and 20 total shots, which is almost unprecedented and with Ozil being a central part in everything good about the Gunners to date, it's tough to argue against him being the top pick this week, even if the margin is probably a bit smaller than the model currently suggests.
Tottenham
Where are all the Tottenham players? Paulinho (3.7) and Soldado (3.5) are their best options yet find themselves way down the rankings in 16th and 12th places respectively. With a home fixture against Hull, most probably expect them to murder their opponents this week, yet the data suggests otherwise. First, Spurs are only averaging 6.8 SiB at home with a +/- of just 8%, both of which put them in the same league as Sunderland and Norwich rather than Arsenal and Chelsea. Second, Hull have actually been relatively good as suppressing shots away from home and while the results haven't come, they can be forgiven for shipping goals at Chelsea, City, Newcastle and Everton. McGregor's ranking shows that the model doesn't think Hull can necessarily go to White Hart Lane and keep Spurs at bay, but a thumping is not the forecast result either which limits the upside of Soldado and company this week (though he and the other Spurs stars remain solid starters).
Dousing the Fire, Fanning the Flames: Gameweek 8
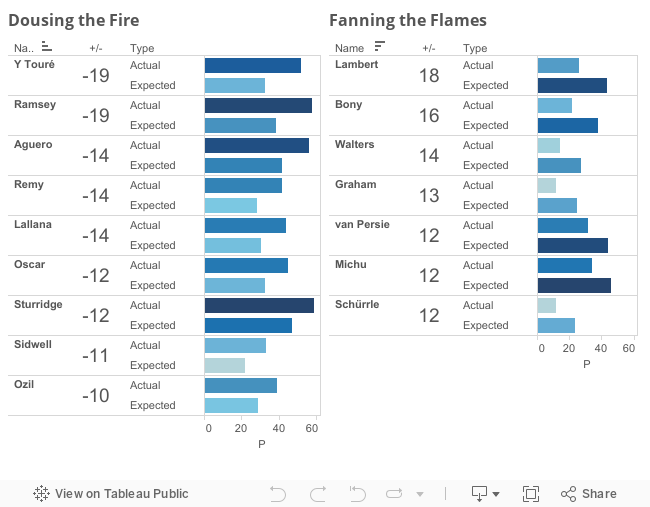
As a quick introduction for those new to the blog, this piece runs every couple of weeks during the season and looks to shine a light on those "hot" players whose "form" looks unsustainable and those "cold" players who should enjoy success in the future if they keep playing the way they have to date. The below chart shows this week's subjects, with those on the left having outscored their underlying data and those on the right having outperformed their score.
Before we start, as is becoming a tendency on this blog, I need to add a quick caveat as to exactly what we're saying here. First, we are not saying that a player will somehow "get back" or "give back" their production to date or that bad luck will necessarily follow good luck. We are saying that players' (and teams') conversion rates should regress to the mean, seeing them earn points at a rate more in line with their underlying stats (which could be a good or bad thing, depending on which side of the below ledger you find yourself). Second, just because a player has outperformed their stats doesn't mean they don't represent a good pickup. If a 5.0m midfielder had 47 points to date but we believed he had only "earned" 36, he would place highly in the 'overperforming' rankings (-11) yet still represent the best budget midfielder in the league. Similarly, a player could have "earned" 36 points, a +7 compared to an actual total of 29, yet would be a relatively poor investment if his price tag was 12.0m. The point, of course, is that context is key, and that's what we hope to establish in the narrative below the chart.
With eight weeks in the books, it's just about time to look at some of the early over and under achievers and take a look at their underlying data to see where the model foresees them heading in the future. To get the most out of the below analysis, I recommend opening the player dashboard so you can play along at home.
Dousing the Fire
Yaya Toure -19
Yaya is a tough player to get a handle on as he does seem to outperform his underlying stats with some consistency (well. in his couple of years in England at least). That said, his goals per shots on target rate (G/SoT) still sits at almost 60% which is almost double what we'd expect and we'd forecast it to continue to regress as it has over the past few weeks. On the positive side, the current iteration of the model probably underestimates his bonus potential somewhat, given that he can impress the bonus system with passing, tackling and shooting (as opposed to, say, someone like Ozil who offers very little in the defensive half of the pitch). Currently we award 1.8 bonus points per goal scored (based on observed averages from the past two seasons) so this difference isn't going to bridge the gap between his points and expected points (xP) anytime soon. His xP of 33 puts him as a borderline top-10 midfielder and the certainty with which he produces adds to his value, yet at 9.5m we need to see an elite ceiling and floor and the data just doesn't suggest Toure can be that man. It's hard to sell on a high performing player owned by 37% of managers but all signs point in that direction right now.
Status: Sell unless you feel you strongly value consistency over value
Aaron Ramsey -19
Ramsey is enjoying an outstanding season and this ranking shouldn't be considered any kind of slight against his efforts to date. True, he's highly unlikely to continue to convert SoT at a 60% clip and created chances (CC) at a 43% rate, yet his production can take a huge hit and he'd still represent outstanding value. His xP of 39 is still 4th among all midfielders (Michu, Gerrard and Paulinho) and only Brady (whose value is largely wrapped up in penalties) and Mirallas can come close in his price range. Despite a trip to Old Trafford, the upcoming fixtures look reasonable and so current Ramsey owners should be happy riding the Welshman even if we expect his production to slow in the current weeks.
Status: Buy. He'll regress but has produced enough to more than justify his cost
Sergio Aguero -14
Aguero is quite possibly the best forward in the league and if there is one player whose totals I might be willing to accept won't regress all the way to a mean, Aguero would be in the conversation. Though high, a 50% G/SoT isn't insane for a player of his caliber, receiving the kind of quality chances he has, though of course some regression would be expected. We can also expect some decline in that shot on target rate (SoT%) which currently sits at 66%, up from 41% in prior year (for comparison, last season van Persie sat at 45%, Benteke at 38%). This could be partly offset by an overall improvement from City (who are averaging a full two shots less per game than prior year), but barring a dramatic shift, we're likely to see Aguero's incredible strike rate slow a little. With an xP of 42, Aguero has been excellent however you look at it, but at 11.0m+, some caution must be exercised by those looking to bring him in at the expense of the cheaper group of Sturridge, Giroud and Soldado.
Status: Hold. Has about as much upside as anyone yet hasn't produced enough to imply he's definitely worth the extra cost over his peers.
Loic Remy -14
Many will be surprised to see Remy on this list, not because we're saying he's overachieved but that to draw such a conclusion means the player has achieved something. Remy has received very little attention and just an 8% ownership number, despite notching five goals in his five starts this year for Newcastle and coming in at a reasonable price tag. He has, however, a couple of black marks against his name. First (as with most players in this list), his G/SoT of 63% is unsustainably high and almost double his historic rate of 32%. Second, he has been deployed in a deeper role in occasion with Cisse leading the line, yet has offered very little by way of assist potential, making him a one category fantasy player not playing in a position where he can best contribute to that category. We've seen players succeed in deeper roles before, so the latter point isn't a death sentence, but it is an issue when viewed together with his useful but not terribly inspiring xP of 28.
Status: Hold for this week against Sunderland but long term he could be considered for sale if better options emerge.
Adam Lallana -14
Another player who has received very little attention, Lallana comes out of GW8 with 44 points, a 4th placed midfielder ranking yet an ownership number of just 5%. Back to back double digit gameweeks will likely get the attention of the masses though, so the question as to the sustainability of his recent success becomes key. Though the model sees him as more of a 30 point player than one pushing the top of the leaderboard, several factors still go in his favour. First, his xP of 30 would still put him 11th among midfielders, with only two of those ahead of him (Brady and Townsend) available for a lower price. Second, no single factor in his underlying profile suggests steep regression is in his future. A 40% G/SoT looks a touch high but nothing to be worried about, though his A/CC% rate of 20% does look a bit high compared to his team's conversion totals to date.
Status: Buy. He isn't an elite midfielder but he doesn't need to be to produce value at 6.2m. Southampton have played better of late and have some promising fixtures on the horizon (starting this week with Fulham at home) and Lallana is well placed to take advantage of most good things his team does.
Oscar -12
Oscar is in a very similar position to Yaya Toure in that he's been excellent this year (xP 33) and could finish the season as a top-10 midfielder, yet at 9.0m his production is unlikely to offer excellent value. He hasn't proven to be a particularly clinical player in the past (largely driven by his percentage of long range efforts) so a 57% G/SoT is obviously not something to rely on. The bigger concern with him though is the issue of rotation as Mourinho has shown a tendency to shuffle his pack with some regularity. Oscar has been voluntarily benched twice already and with Champions League action in full swing coupled with Chelsea's excellent depth in midfield, we can expect that trend to continue over the coming weeks.
Status: Sell. Oscar is far from a bad option and his recent resting could suggest he plays the next couple of games. But, given that they include the visit of City and a tough trip to Newcastle, we could see Oscar essentially contribute nothing for the next month or longer if the regression monster really starts to kick in.
Daniel Sturridge -12
The question has arisen over the last few weeks whether Sturridge or Suarez is the best option in this promising Liverpool side and while the first reaction was Suarez, it is a very close call. This -12 score suggests Sturridge has overachieved, yet that's only because he's coming from such a ridiculously lofty position. Seven goals in eight games is almost unprecedented and only 39 players managed to score in seven different games all season last year, with players like Aguero (11), Hazard (9) and Rooney (8) not eclipsing that total by a wide margin. Sturridge's xP of 47 leads the league and the only real red flag in his data is his A/CC rate of 40%, though given that (a) not too much of his value is tied up in assists and (b) he has the potential to earn easy assists by squaring to Suarez, even that figure shouldn't terrify you. It should be noted that Suarez has posted outstanding numbers in his three game sample (earning an xP of 20 or 6.66 per game compared to Sturridge's 5.9 per game rate) but essentially both have the potential to lead the league in fantasy points and the key decision right now is whether you value a lower price (Sturridge) or a "differential" option (I use that term lightly given Suarez's 19% ownership number, but it's certainly preferable to Sturridge's 41%).
Status: Buy. Gun to my head, I still believe Suarez is the slightly better play, but given the lower price tag and statistical performance to date, you can't go wrong with either right now.
Steve Sidwell -11
Sidwell was highlighted in the preseason as a solid minimum priced option, though obviously it wasn't forecast for him to sit just outside the top-ten among all midfielders at any point of the season. In reality, of course, that lofty ranking is sure to collapse in the coming weeks with Sidwell representing one of the more extreme regression candidates in the league. The Fulham man has notched just four total shots with two on target (100% G/SoT), putting him in line with such goal scoring titans as Luke Shaw or James Tomkins. Incredibly, his A/CC rate is also 100%, a rate that will also plummet as the season progresses, no matter how clinical Dimitar Berbatov might be. 5.0m options are essentially a lottery and few, if any, will provide any kind of sustained production, so in that sense Sidwell's reliable playing time keeps him ownable. That said, for just 0.2m more, Brady is the current holder of penalty duties for Hull, a fact that should ensure he continues to pull away from Sidwell as the season progresses.
Status: Hold. Selling Sidwell isn't a priority but you need to be realistic about you have here.
Mesut Ozil -10
Ozil's dashboard is somewhat idiosyncratic, with a number of areas looking set for regression is opposite directions. He's actually performed below expectations in terms of G/SoT with a rate of just 29% compared to his historic average of 38%. On the flip side though, he's hit the target at an incredible (an unsustainable) rate of 88% which will cancel out most of any gains seen on his G/SoT rate. His A/CC rate of 33% looks high, even compared with Arsenal's excellent 19% average (the league sits at just over 10%), though the quality of his play and his teammates finishing ability could well see him finish the year at a rate well above league average. His 5.8 xP per game leads all midfielder to date and there's no metric to find that really suggests anything but a stellar season for the German playmaker, even if it doesn't finish with him notching a 7.8 PPG score.
Status: Buy
Fanning the Flames
Rickie Lambert +18
Lambert's numbers are fairly incredible to date, notching an xP of 44 (4th highest in the league) yet coming in just 15th among forwards in actual points. A low G/SoT should regress in the coming weeks and with a good share of Southampton's shots in the box, he should benefit from Southampton's improving play. The next three games look very promising and there are really no other reliable options in Lambert's price range who can offer the same level of upside and consistency.
Status: Strong buy
Wilfried Bony +16
Bony has been solid when he has featured for Swansea but has been slowed by missing a couple of games along with the unusual position of scoring two goals and an assist yet earning zero bonus points. Bony has accounted for 38% of Swansea's SiB when he's played which is an excellent rate and we'd expect some improvement from his 25% G/SoT rate, even if his historic rate sits at just 32%.
Status: Buy. At 7.5m there is value to be found here, especially given his penalty duties and upcoming fixtures, though between the two options above, the data gives a slight edge to Lambert.
Jon Walters +14
Walters has been better than his production suggests, hitting the target four times already without any returns. Yet, even if converting as expected, his xP of 28 would be just about in line with his price tag and not really offer a great deal of upside compared to his comparatively priced peers. Ownable? Sure. A key target? Not really, especially considering his team's attacking struggles.
Status: Sell, or hold if your team has serious issues to address.
Danny Graham +13
Graham has put in some decent displays for Hull without any reward, both in terms of goals and assists. His upside is limited, but at 5.1m he can be a useful bench option for those looking to minimise their expense on the bench. Unfortunately, Graham has picked up a knee injury and will likely miss a couple of games, but he can be considered for review once he returns.
Status: Monitor on his return from injury for increased signs of life.
Robin van Persie +12
van Persie's underlying numbers remain very good (xP 44) though a combination of a bit of bad luck coupled with that extortionate price tag have led to him being labelled a bust so far this season. The last three weeks have seen over half a million managers sell the Dutchman, somewhat strange timing given the next four promising games. Before the season I maintained that it was all but impossible for him to justify the extra investment needed to bring him in and despite his +12 mark here, the fact still remains that other players can offer similar returns for a much lower price. If timed right, I can see van Persie being a player to target when playing your wildcard; to try and milk as much value as possible over a short period, but unless we see a significant turn around from United, it's unlikely that he'll be the elite captain option every week, as he was last season.
Status: Buy in terms of production but the price tag would still scare me off.
Michu +12
Another of last year's elite is having some comparative struggles so far this year, though here we see a player who is really suffering through some unfortunate conversion rates. His G/SoT rates have been excellent throughout his career (in Spain and England) yet currently sits at just 20%, less than half of his 46% average. It's a similar story on the assist front, with his A/CC of 7% again coming in at around half of his team's average (13%). His xP of 46 simply leads all midfielders and is second only to Sturridge (47) overall and the upcoming fixtures look outstanding right up to Christmas, other than a tough trip to the Etihad in GW13.
Status: Buy. Not a true differentiator with an ownership number of 16%, yet he offers elite upside and a nice alternative to the overly familiar pair of Yaya Toure and Ozil.
Andre Schurrle +12
Given his price tag and classification as a midfielder, it would be great to add Schurrle to our shortlist, yet a lack of playing time and rotation risk makes him all but impossible to own for the foreseeable future.
Status: Monitor for playing time improvement.
Friday, October 18, 2013
Gameweek forecasts: a couple of case studies
Producing forecasts is a tricky business. Even with hindsight it is tough to predict the expected outcome of a given game (i.e. how shots transform into goals) and that problem increases exponentially when you also need to try and forecast the underlying data. Throw in uncertainty around how much players will play and the issue of small sample sizes and you have a recipe for some funky results over these early weeks of the season. First, to make sure the model isn't totally off track, let's look at how it performs retrospectively over the first seven weeks of the season (using actual shot totals as inputs):
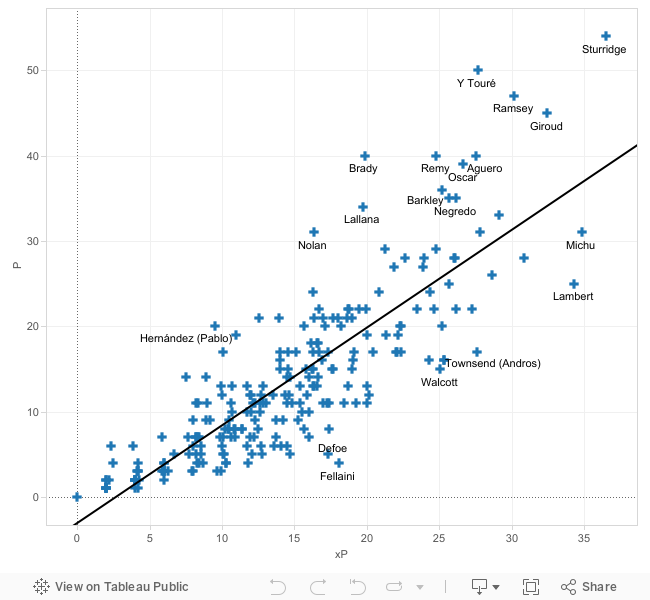 Though we can see outliers in the above chart (especially at the top end of the market), the overall trend is promising and the r-squared of 57% for players with a risk factor of 2.5 or less is encouraging enough. That's not to say it's infallible, but it's a good start and for the majority of the extreme outliers we can point to specific factors which have led to their strong results (Yaya Toure is unlikely, for example, to convert his shots on target into goals at a 66% clip for the rest of the season).
So if we're happy that the model is working relatively well over a medium length period, let's get into the forecast side (which include predicting how many shots a player will get and how they will be converted) and look at a couple of actual examples from this week's forecast:
Loic Remy 7.3 points (you'll need to slide the risk slider to 2.7 or more to see him included)
Remy represents one of the dangers of forecasting in the early weeks; a problem that is compounded by the fact that Remy has only started four times. When he has played he's been nothing short of spectacular, averaging 4.4 shots per 90 minutes, hitting the target 50% of the time (a very useful rate). Despite this success, I imagine most people who asked about this forecast were confused given Newcastle's opponents. With just four goals conceded on the season, Liverpool have appeared to be a very useful defensive side and thus don't immediately jump out as a team you want to start your forwards against. However, digging a bit deeper we see a team with a +/- SiB rate of 22% away from home, surrendering the same number of SiB as teams like Villa and Cardiff (this despite playing AVL, SWA and SUN). This isn't to say, of course, that Newcastle are set to put Liverpool to the sword this week, but looking purely at the data, the Magpies' prospects this week are better than most would probably think (the model estimates them to notch around 9 SiB this week). With Remy accounting for 40%+ of his team's SiB, the model likes his chances this week, even if the intangible factors (playing time risk, wide role) suggest more caution.
Daniel Sturridge 4.6 vs Luis Suarez 4.1
If Remy is giving us trouble with five appearances, things get even tougher with Suarez who has played just twice. I suppose we could lean on prior year data but without wanting to reinvent the whole model for every idiosyncrasy, we'll just live with it. Long term I would personally back Suarez to top his English colleague in the scoring charts, though as this is a stat based site, I've nothing to base that on other than past events so it doesn't make it into the model. As always, these forecasts should support our decisions and if something seems off then we should simply ignore it.
Stevan Jovetic 7.3 (risk rating 3.9)
This is something of a "damned if you do, damned it you don't" situation as if I exclude players from the weekly listings I inevitably get questions where Player X is, and then when they're in, it seems ridiculous to rank the scarcely-used Jovetic as the top option. For clarity, all players make the listings and you can filter down to more reliable options using the risk slider. Jovetic's sample size is almost certainly too small to be particularly reliable and thus the 7.3 points ranking isn't wholly useful, but if you think this then simply ignore him. I prefer this approach rather than me deciding who is/isn't relevant and having readers miss out on a sleeper prospect they are targeting. This is the same approach used by publications like Baseball Prospectus who generate PECOTA forecasts for minor league players on the assumption they get major league playing time (and it's to the manager, player and luck whether the youngster gets his shot). For what it's worth, in his limited time Jovetic has been excellent (6 shots, 4 SiB and 2 SoT in just 85 minutes) and thus the model likes him to succeed were he to be given time in this talented City side.
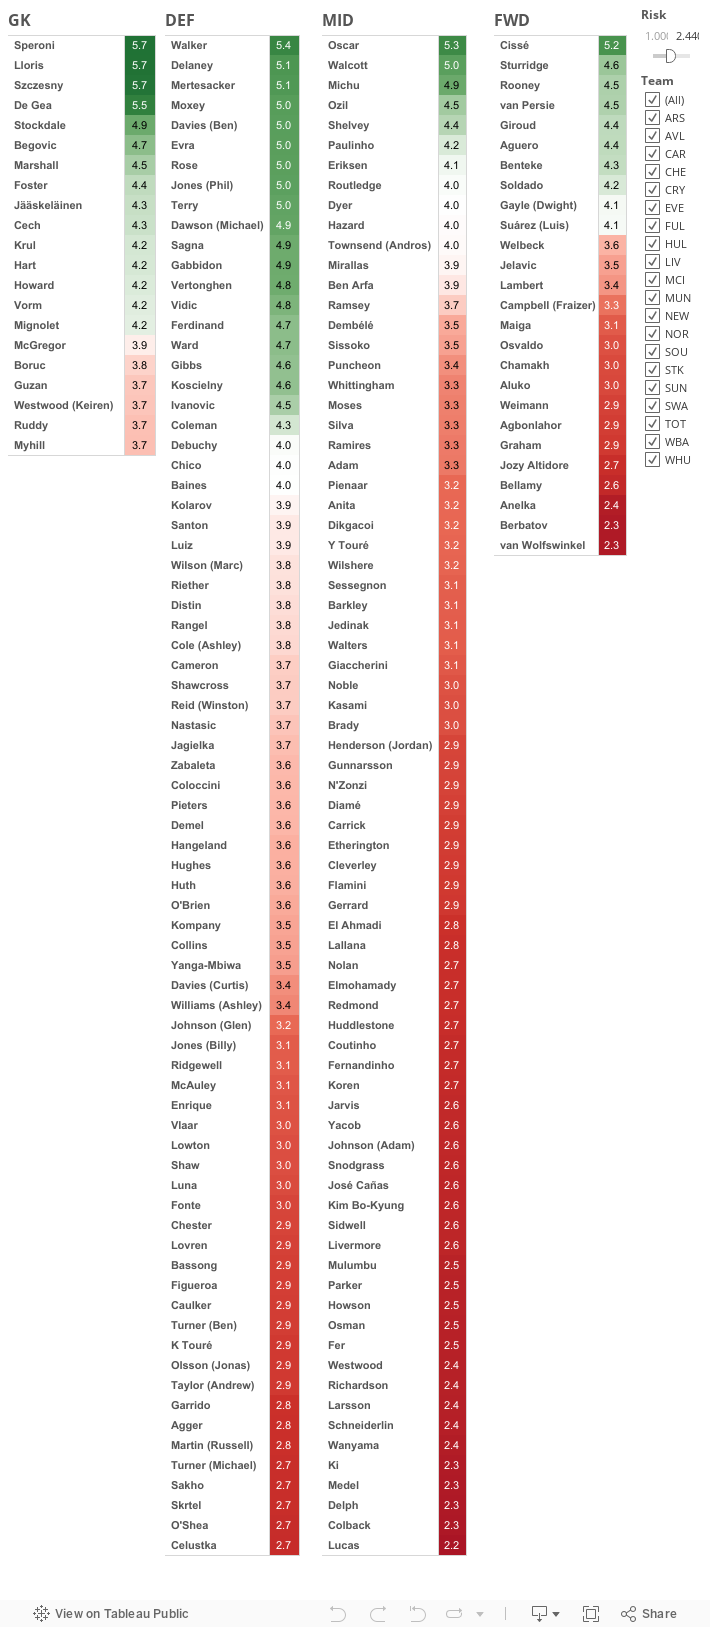
Julian Speroni 5.7
This is probably the strangest forecast for the week and I must admit, I went back to recheck the data myself before posting these numbers. The fact that it's Speroni (and hence Crystal Palace) is somewhat surprising though when you consider their opponents' pathetic efforts away from home to date, it doesn't seem overly unusual to see Palace ranked well this week (indeed they would rank 3rd in the standard "goals per game" projections from last season). The issue then, is more that a goalkeeper is the week's highest ranked player with a low risk rating which doesn't feel quite right. Part of this is simply the perception of fantasy players and part of it is a lack of sophistication with the model.
On the first point, Artur Boruc ranks 9th among all players this year and three 'keepers place in the top-15 so in reality it isn't particularly surprising to suggest a 'keeper will score well (remember that they tend to earn more points than defenders per clean sheet due to the presence of saves). They lack the upside of defenders who can also score or notch assists, but for most players the chance of those events is fairly low and thus doesn't have a huge factor on a weekly ranking. The second point is a bigger issue and that's how 'keeper points are calculated. Right now, saves are awarded on a very crude average basis which doesn't take into account the propensity for earning saves in a given game. Thus, while Speroni has racked up decent save totals to date, if his chances of a clean sheet are higher this week then his save totals should go down, but the model doesn't make such an adjustment. This is unlikely to result in more than a half point variance in a given week though.
The wider point on 'keepers and to a lesser degree defenders is that the forecast is more likely to be wrong on them in a given week as their chances of success is a little bit "all or nothing" (where as midfielders can earn points for clean sheets, assists, goals and are more likely to get the bonus nod). I still feel fairly confident is using this data for ranking purposes but wouldn't suggest captaining Speroni (5.7) over someone like Michu (4.9) given the exponentially higher upside enjoyed by the Swansea man. To repeat, this data is based on logic but a simple model cannot account for every possibility so personal judgement is still required.
Hopefully these examples gave a bit more detail to how the weekly rankings are made and we'll continue to check back to see how they are performing as the season goes on (we'll hopefully see some of the stranger outliers disappear as sample sizes start to increase). Thanks for reading and for sticking with the blog during the quiet opening weeks and please continue to send your questions to @plfantasy, on Facebook or in the comments below.
So if we're happy that the model is working relatively well over a medium length period, let's get into the forecast side (which include predicting how many shots a player will get and how they will be converted) and look at a couple of actual examples from this week's forecast:
Loic Remy 7.3 points (you'll need to slide the risk slider to 2.7 or more to see him included)
Remy represents one of the dangers of forecasting in the early weeks; a problem that is compounded by the fact that Remy has only started four times. When he has played he's been nothing short of spectacular, averaging 4.4 shots per 90 minutes, hitting the target 50% of the time (a very useful rate). Despite this success, I imagine most people who asked about this forecast were confused given Newcastle's opponents. With just four goals conceded on the season, Liverpool have appeared to be a very useful defensive side and thus don't immediately jump out as a team you want to start your forwards against. However, digging a bit deeper we see a team with a +/- SiB rate of 22% away from home, surrendering the same number of SiB as teams like Villa and Cardiff (this despite playing AVL, SWA and SUN). This isn't to say, of course, that Newcastle are set to put Liverpool to the sword this week, but looking purely at the data, the Magpies' prospects this week are better than most would probably think (the model estimates them to notch around 9 SiB this week). With Remy accounting for 40%+ of his team's SiB, the model likes his chances this week, even if the intangible factors (playing time risk, wide role) suggest more caution.
Daniel Sturridge 4.6 vs Luis Suarez 4.1
If Remy is giving us trouble with five appearances, things get even tougher with Suarez who has played just twice. I suppose we could lean on prior year data but without wanting to reinvent the whole model for every idiosyncrasy, we'll just live with it. Long term I would personally back Suarez to top his English colleague in the scoring charts, though as this is a stat based site, I've nothing to base that on other than past events so it doesn't make it into the model. As always, these forecasts should support our decisions and if something seems off then we should simply ignore it.
Stevan Jovetic 7.3 (risk rating 3.9)
This is something of a "damned if you do, damned it you don't" situation as if I exclude players from the weekly listings I inevitably get questions where Player X is, and then when they're in, it seems ridiculous to rank the scarcely-used Jovetic as the top option. For clarity, all players make the listings and you can filter down to more reliable options using the risk slider. Jovetic's sample size is almost certainly too small to be particularly reliable and thus the 7.3 points ranking isn't wholly useful, but if you think this then simply ignore him. I prefer this approach rather than me deciding who is/isn't relevant and having readers miss out on a sleeper prospect they are targeting. This is the same approach used by publications like Baseball Prospectus who generate PECOTA forecasts for minor league players on the assumption they get major league playing time (and it's to the manager, player and luck whether the youngster gets his shot). For what it's worth, in his limited time Jovetic has been excellent (6 shots, 4 SiB and 2 SoT in just 85 minutes) and thus the model likes him to succeed were he to be given time in this talented City side.
Julian Speroni 5.7
This is probably the strangest forecast for the week and I must admit, I went back to recheck the data myself before posting these numbers. The fact that it's Speroni (and hence Crystal Palace) is somewhat surprising though when you consider their opponents' pathetic efforts away from home to date, it doesn't seem overly unusual to see Palace ranked well this week (indeed they would rank 3rd in the standard "goals per game" projections from last season). The issue then, is more that a goalkeeper is the week's highest ranked player with a low risk rating which doesn't feel quite right. Part of this is simply the perception of fantasy players and part of it is a lack of sophistication with the model.
On the first point, Artur Boruc ranks 9th among all players this year and three 'keepers place in the top-15 so in reality it isn't particularly surprising to suggest a 'keeper will score well (remember that they tend to earn more points than defenders per clean sheet due to the presence of saves). They lack the upside of defenders who can also score or notch assists, but for most players the chance of those events is fairly low and thus doesn't have a huge factor on a weekly ranking. The second point is a bigger issue and that's how 'keeper points are calculated. Right now, saves are awarded on a very crude average basis which doesn't take into account the propensity for earning saves in a given game. Thus, while Speroni has racked up decent save totals to date, if his chances of a clean sheet are higher this week then his save totals should go down, but the model doesn't make such an adjustment. This is unlikely to result in more than a half point variance in a given week though.
The wider point on 'keepers and to a lesser degree defenders is that the forecast is more likely to be wrong on them in a given week as their chances of success is a little bit "all or nothing" (where as midfielders can earn points for clean sheets, assists, goals and are more likely to get the bonus nod). I still feel fairly confident is using this data for ranking purposes but wouldn't suggest captaining Speroni (5.7) over someone like Michu (4.9) given the exponentially higher upside enjoyed by the Swansea man. To repeat, this data is based on logic but a simple model cannot account for every possibility so personal judgement is still required.
Hopefully these examples gave a bit more detail to how the weekly rankings are made and we'll continue to check back to see how they are performing as the season goes on (we'll hopefully see some of the stranger outliers disappear as sample sizes start to increase). Thanks for reading and for sticking with the blog during the quiet opening weeks and please continue to send your questions to @plfantasy, on Facebook or in the comments below.
Thursday, October 17, 2013
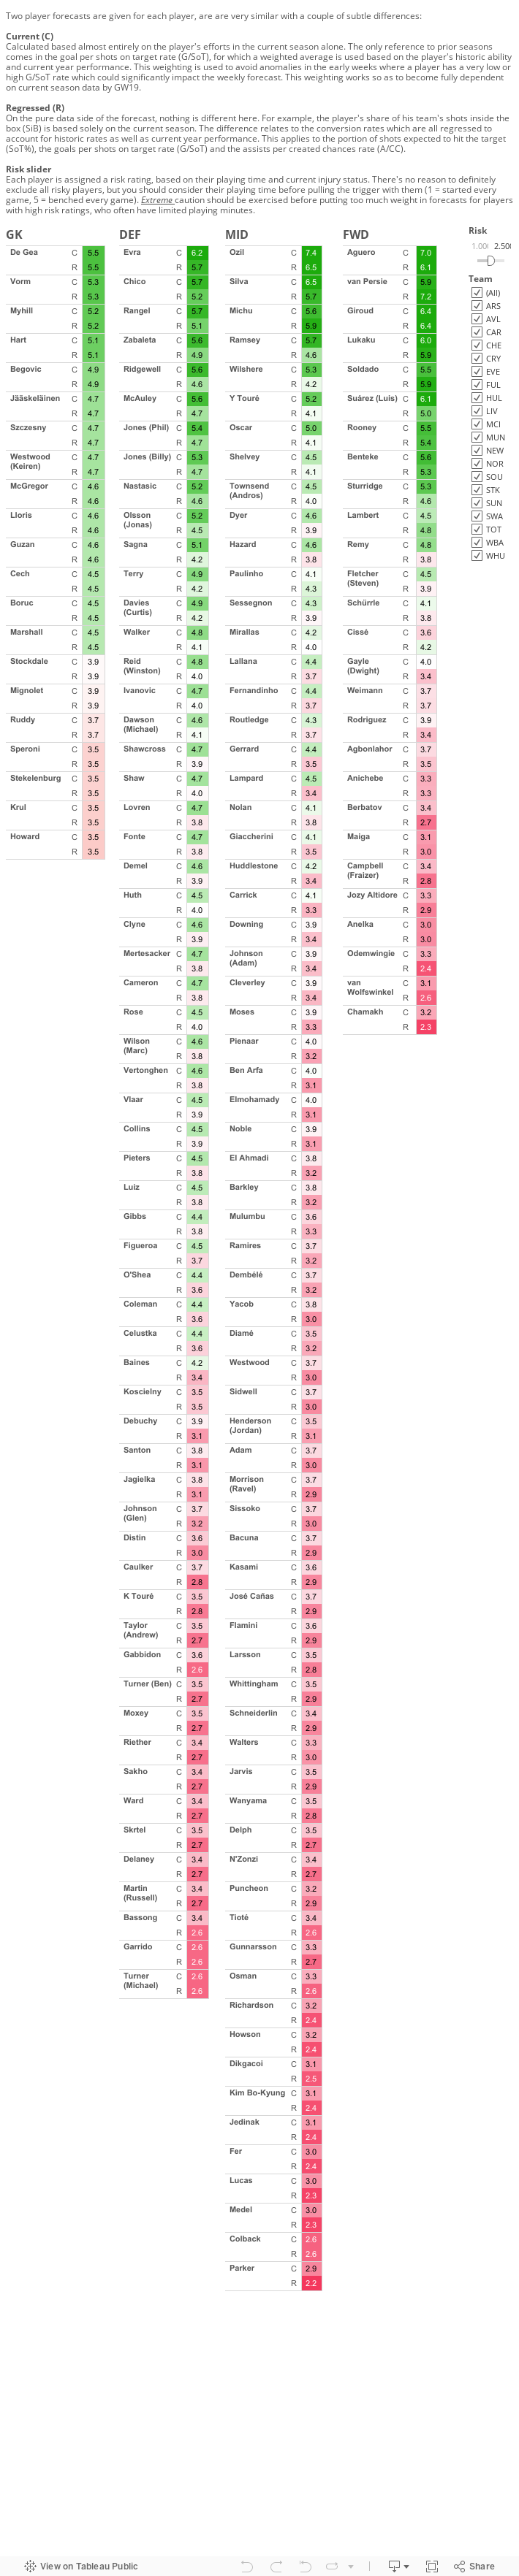
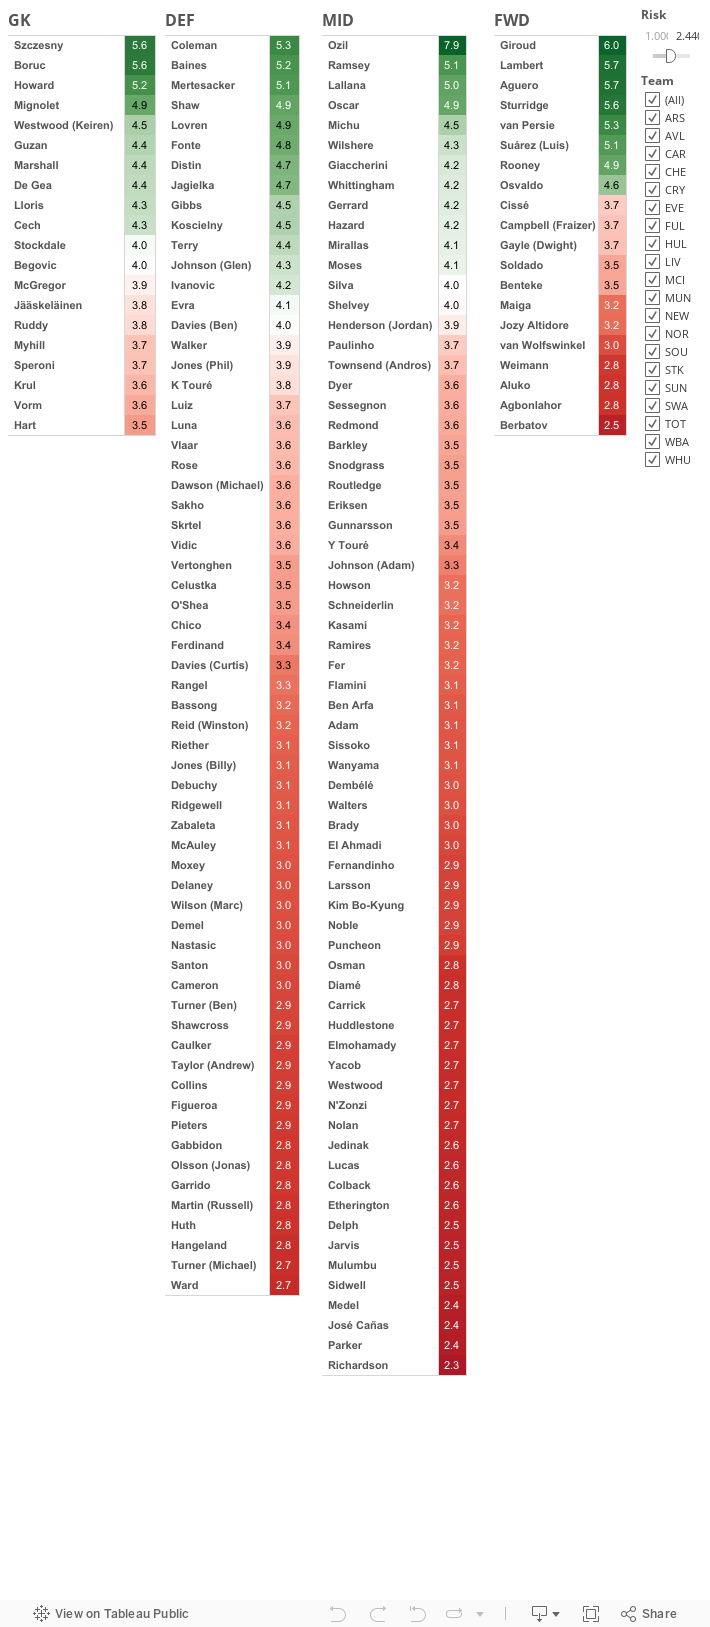
Gameweek 8 forecast
Risk slider - this season each player is assigned a risk rating, based on their playing time and current injury status (as explained here). There's no reason to definitely exclude all risky players, but you should consider their playing time before pulling the trigger with them.
I've had a couple of questions about a couple of the 'odd' forecasts above, namely Loic Remy's lofty status and how Sturridge out ranks Suarez. I'll address those in more detail tomorrow but wanted to get the data out now.
Wednesday, October 16, 2013
Player Dashboards explained
Hopefully you've had a chance to look at the new player dashboard which has launched this week and can be found here or by following the link on the menu bar above. I'm sure that for the most part the data is self explanatory but I thought it might be useful to quickly run through the new features so you can get the most out of them. Let's start with the points section:

1. Here we simply see the players' actual points by week plotted against their expected total. One key to note here is that the expected number is based on their actual shot data rather than the forecast number that will be given each gameweek starting with this one. Point being, the expected number shows how many points we'd expect a given player to score given all the other events observed from his performance.
2. This is a somewhat crude depiction of how each players' points total was earned. You can hover over each slice of pie for an explanation, namely:

4. As with the points chart above in (1), this chart plots actual goals scored against expected goals, again based on the actual shots registered by the player in a given game. Comparing these on a one-game, weekly basis is probably not a great idea, but over a longer period we can identify players who are perhaps getting a bit unlucky and under-performing their underlying stats and thus might be undervalued by the market.
5. These simple pie charts show the split between:

7. These charts highlight:

1. Here we simply see the players' actual points by week plotted against their expected total. One key to note here is that the expected number is based on their actual shot data rather than the forecast number that will be given each gameweek starting with this one. Point being, the expected number shows how many points we'd expect a given player to score given all the other events observed from his performance.
2. This is a somewhat crude depiction of how each players' points total was earned. You can hover over each slice of pie for an explanation, namely:
- Appearance (less yellow and red cards): blue
- Goals: green
- Assists: orange
- Defense (clean sheets less points lost for conceding 2+ goals): red
- Bonus points: Yellow
3. The +/- score quickly shows whether a player is under or over-performing his expected points total. A positive number suggests he has under performed his total and thus should be due for some positive regression should he continue to produce shots / create chances etc at a consistent rate. Note that we're not saying that this gap will necessarily closed, only that we'd expect his future totals to match more closely his expected numbers.

5. These simple pie charts show the split between:
- pSiB% - the percentage of a team's shots inside the box that the given player has accounted for (adjusted for the time actually spent on the field)
- pSoB% - the percentage of a team's shots outside the box that the given player has accounted for (adjusted for the time actually spent on the field)
- SoT% - the percentage of the player's shots that hit the target. Most research I've performed suggests this is a sustainable skill and won't regress to a league average rate, though we might expect it to regress to a player's own historic rate (a player can't for example, hit the target with 80% of his shots over a sustained period).
- SiB% - the percentage of a player's shots that were taken inside the box.
6. A player's goals per shots on target rate is somewhat complex but in the majority of my research I've found that for the most part it tends to regress towards something of a mean. Some players - though not particularly the first ones you'd think of - have show an ability to exceed the league average with some consistency, though I haven't done a full enough test to determine if these are simply expected statistical outliers. For now then, we have two different graphs to show. For lower profile players we can see their G/SoT rate for this season against the league average rate for their position. For the more established players, or those who bring a strong pedigree of success from other elite leagues, we've highlighted their historic rate as the comparison. Where available a bias is given to (i) time played on the current team, then (ii) time played in the Premier League, but we've used other league data for players like Ozil or Soldado on the assumption that these elite few need some recognition as being better than simply average.

7. These charts highlight:
- pCC% - the share of his team's created chances for the given player
- Final third passes - the percentage of a player's passes made in the final third of the pitch
8. The assist per created chance rate works similarly to the G/SoT rate described in (6) above. The key difference is the average rate comparison which for this metric is the rate for the player's team as a whole. For example, the above shows Aguero enjoying a 38% rate while City as a whole have seen their created chances converted at just an 18% clip. Allowing for some variance given the quality (and position) of pass made by Aguero versus some of his teammates, we might suggest that he's due for some regression in this area as the season progresses.
Sunday, October 6, 2013
Clean Sheet Conversion Rates
Alright, enough is enough. While I'm concerned about delving into data too soon and reaching all sorts of ridiculous small-sample-driven conclusions, I'm equally conscious that people want to start making big decisions with their respective teams and thus it's time to launch the weekly rankings and forecasts (still with that small sample asterisk though).
Before that, let's look at a new addition to the weekly forecasts. With most of the forecasts we do on this site, there are two distinct parts to the puzzle:
Converting shots into goals
This is the reverse analysis of the time we've spent looking at player shots becoming goals, though we're going to be looking at it slightly differently as we're dealing with game totals for a team rather than an individual player. The below data is taken from the 2012-13 season only (plus a little bit of the new season), which isn't an ideal sample size, but is all I have to work with for now. If anyone has any differing conclusions stemming from prior years, please share them in the comments below or via email.
The below tables show the percentage of games which became clean sheets after a team conceded the noted number of shots inside the box (SiB) and shots on target (SoT).

The first point to note of course is that (thankfully) the data makes sense - especially in the larger 2012-13 sample - and a team's chance of keeping a clean sheet falls as they concede more shots. Further on that point, you can see that, generally, the first few chances you concede greatly diminish your chance at a clean sheet, where as once you get into the higher ranges, you don't see such variance as each shot is registered. As an example then, if a team is forecast to concede five SiB and two SoT, the data suggests they have a 43% - 50% (35% - 50% based on prior year) chance at a clean sheet, depending on which metric you look at.
Stop the presses! Less shots conceded equals a better chance at a clean sheet! Admittedly this isn't new news, but by putting some actual percentages to the problem, we can hopefully get to a point where we're getting a usable number each week. Right now, the forecast shot data is converted into goals and we'll say a team is forecast to concede 1.2 goals, but as we know, for fantasy purposes, defensive outcomes are very much all or nothing (plus some small impact of playing someone who concedes a lot of goals but you rarely be in that circumstance). A forecast will never suggest a team will score zero goals so you end up with weekly rankings which are useful when determining whether to play goalkeeper A or B but not so good when assessing whether to play defender A or midfielder B or whether or not to sign a defender for the next five weeks.
Team specific data
As we've seen with converting shots into goals, different teams achieve this at different rates, and based on yearly data, there's reason to believe that the difference is sustainable (better players create better chances which lead to better shots and thus a higher chance of conversion). A similar hypothesis can also be put forward then for goals conceded (better teams limit opponents to either shots outside the box, from tight angles or contested efforts and thus will see them converted at a lower rate). Thus, we should look at how different teams saw their surrendered chances converted into goals, before assuming we can use a standard league-wide average. This analysis is prone to small sample size issues, given that a team might only register a particular event once all season. For example, in the last game of last season, Fulham surrendered 16 SiB yet were still able to keep a clean sheet. Given that this was the only time they conceded such a total all year, the data would suggest they have a 100% conversion rate to apply to future games where they concede such a huge haul of shots. This is clearly a perverse situation but is combated by:
For reference, the conversion totals (regressed) for each team in each SiB and SoT range for the current year to date are as below:

After just seven weeks, it's to be expected that the team-by-team rates are all very close, as we simply don't have enough data for anyone to really distinguish themselves from average. These rates will likely diverge a bit as the season progresses and we can check back in a few weeks to identify any trends or issues here.
A worked example
Let's look at this week's contest at the Etihad to put the above into context:
Before that, let's look at a new addition to the weekly forecasts. With most of the forecasts we do on this site, there are two distinct parts to the puzzle:
- What is the expected volume of an underlying event (normally we focus on shots, shots on target etc)
- What is the impact of those events on actual footballing events (i.e. goals, assists and clean sheets).
Converting shots into goals
This is the reverse analysis of the time we've spent looking at player shots becoming goals, though we're going to be looking at it slightly differently as we're dealing with game totals for a team rather than an individual player. The below data is taken from the 2012-13 season only (plus a little bit of the new season), which isn't an ideal sample size, but is all I have to work with for now. If anyone has any differing conclusions stemming from prior years, please share them in the comments below or via email.
The below tables show the percentage of games which became clean sheets after a team conceded the noted number of shots inside the box (SiB) and shots on target (SoT).

The first point to note of course is that (thankfully) the data makes sense - especially in the larger 2012-13 sample - and a team's chance of keeping a clean sheet falls as they concede more shots. Further on that point, you can see that, generally, the first few chances you concede greatly diminish your chance at a clean sheet, where as once you get into the higher ranges, you don't see such variance as each shot is registered. As an example then, if a team is forecast to concede five SiB and two SoT, the data suggests they have a 43% - 50% (35% - 50% based on prior year) chance at a clean sheet, depending on which metric you look at.
Stop the presses! Less shots conceded equals a better chance at a clean sheet! Admittedly this isn't new news, but by putting some actual percentages to the problem, we can hopefully get to a point where we're getting a usable number each week. Right now, the forecast shot data is converted into goals and we'll say a team is forecast to concede 1.2 goals, but as we know, for fantasy purposes, defensive outcomes are very much all or nothing (plus some small impact of playing someone who concedes a lot of goals but you rarely be in that circumstance). A forecast will never suggest a team will score zero goals so you end up with weekly rankings which are useful when determining whether to play goalkeeper A or B but not so good when assessing whether to play defender A or midfielder B or whether or not to sign a defender for the next five weeks.
Team specific data
As we've seen with converting shots into goals, different teams achieve this at different rates, and based on yearly data, there's reason to believe that the difference is sustainable (better players create better chances which lead to better shots and thus a higher chance of conversion). A similar hypothesis can also be put forward then for goals conceded (better teams limit opponents to either shots outside the box, from tight angles or contested efforts and thus will see them converted at a lower rate). Thus, we should look at how different teams saw their surrendered chances converted into goals, before assuming we can use a standard league-wide average. This analysis is prone to small sample size issues, given that a team might only register a particular event once all season. For example, in the last game of last season, Fulham surrendered 16 SiB yet were still able to keep a clean sheet. Given that this was the only time they conceded such a total all year, the data would suggest they have a 100% conversion rate to apply to future games where they concede such a huge haul of shots. This is clearly a perverse situation but is combated by:
- Grouping shot totals together into ranges, such 0-4, 5-7 and 8+ SiB conceded rather than looking at each total individually
- Regressing totals back to league average based on the number of occurrences in the population. If, for example, Arsenal have 10 games where they've conceded 4 SiB and posted a clean sheet conversion rate of 50% in those games, we have a lot more confidence in that total than the fact that West Ham are 1 for 2 when conceding 8+ shots. We will therefore use a weighted average between the team rate and the league rate to get our overall expected conversion rate.
For reference, the conversion totals (regressed) for each team in each SiB and SoT range for the current year to date are as below:

After just seven weeks, it's to be expected that the team-by-team rates are all very close, as we simply don't have enough data for anyone to really distinguish themselves from average. These rates will likely diverge a bit as the season progresses and we can check back in a few weeks to identify any trends or issues here.
A worked example
Let's look at this week's contest at the Etihad to put the above into context:
- As in past projections, let's try and get a forecast for the number of SiB and SoT for the coming week. Going into the week City had registered a -32% +/- score (holding opponents to 32% less SiB than they have averaged elsewhere), so with Everton averaging 8 SiB on the road, we get an expected SiB total of 5.4. On the other side, Everton had posted a +/- of 4% on their travels and City had conceded just 4 SiB at home. This gives an expected SiB total of 4.5. Taking an average of these two totals gives an expectation of very close to 5.
- Using the data from above we see that an expected SiB total of 5-7 is converted into a clean sheet 38% of the time (specific to Man City).
- Moving on to SoT, we see that City had posted a very impressive -50% SoT +/- mark at home and so with Everton adding a healthy 4 SoT away from Goodison, we'd give them an expectation of 2 SoT for this game. On the reverse, City have surrendered just 2 SoT per game and Everton's +/- rate of 5% doesn't have much impact here. Again, taking an average of the two marks we get an expectation of 2 SoT for the game.
- Using the aforementioned tables again, we see that 2 SoT converts to a clean sheet at a 44% clip.
- Long term we can look at which of these two forecasts correlates better to the actual data observed, but for now we will simply take a crude average and get a mark of 41%.
- For individual players, the final step is simply to say that a 41% chance of a clean sheet is worth 3.6 points (2 appearance points plus 1.6 for the clean sheet) and that is the number which will then be added to their offensive threat to be included in the eight week forecast / captain rankings.
Subscribe to:
Posts (Atom)